A Fragmented Past Gives Way to a Unified Future
Ten years ago, the FreeWheel team had an idea: to use data and industry insights to explore the changing world of video content monetization. For the past decade, we have analyzed trends in distribution, monetization, audience behavior and ad experience across the U.S. and Europe, drawing on one of the world’s largest datasets on the usage and monetization of professional, rights-managed video content worldwide. By consistently providing data, context, and commentary, the Video Marketplace Report (originally called the Video Monetization Report) became a trusted source across the industry.
In honor of this occasion, we created a special 10-year anniversary edition of the U.S. VMR featuring a timeline of events that shaped TV’s last decade of growth. It draws on data and observations from past VMRs, including a refreshed way of looking at the data, to identify the transformative moments of the past decade and how they line up to data from the second half of 2020. This year, we see a long pattern of fragmentation across systems, content, and operations move towards integration, with notable examples of content aggregation, system simplification, and operational consolidation. Here are some highlights:
The Way Consumers Watch TV is Simplifying
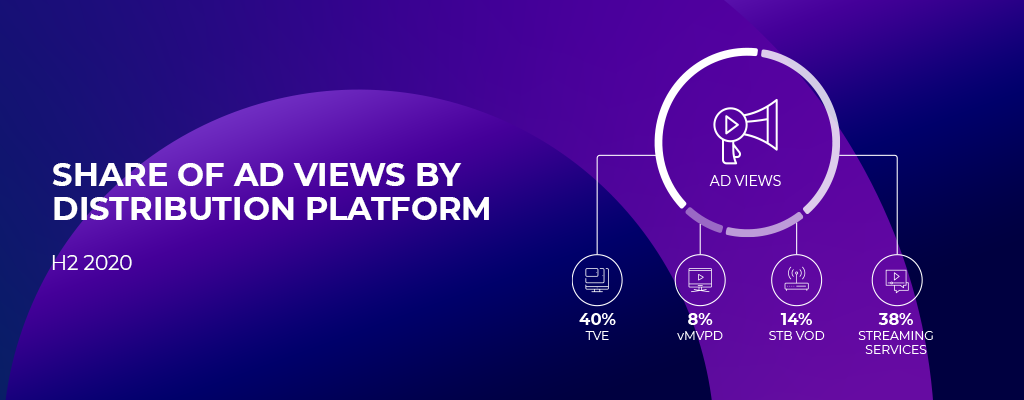
In 2011, traditional media companies launched TV Everywhere (TVE) to give consumers access to content on more platforms. Many publishers, including ESPN, CNN and Fox, launched TVE apps. Reed Hastings, Netflix’s CEO, called TV Everywhere Netflix’s biggest competitor. Jump to 2020 and TVE makes up 40% of video ad views, but Streaming Services are close behind, at 38%, and growing faster than TVE.
The Golden Age of TV Drives CTV Adoption
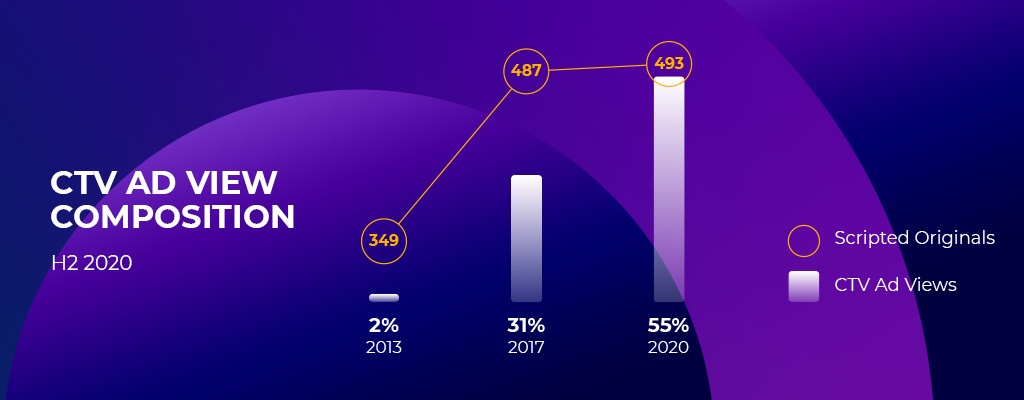
In 2013 the Golden Age of TV ushered in high caliber, scripted shows including AMC’s Breaking Bad and FX’s The Shield. The award winning entertainment accelerated CTV viewership. Back then, only 2% of ad views were on CTV, more than doubling the next year. Seven years later CTV makes up 62% of ad views.
Programmatic Video Solutions are Maturing
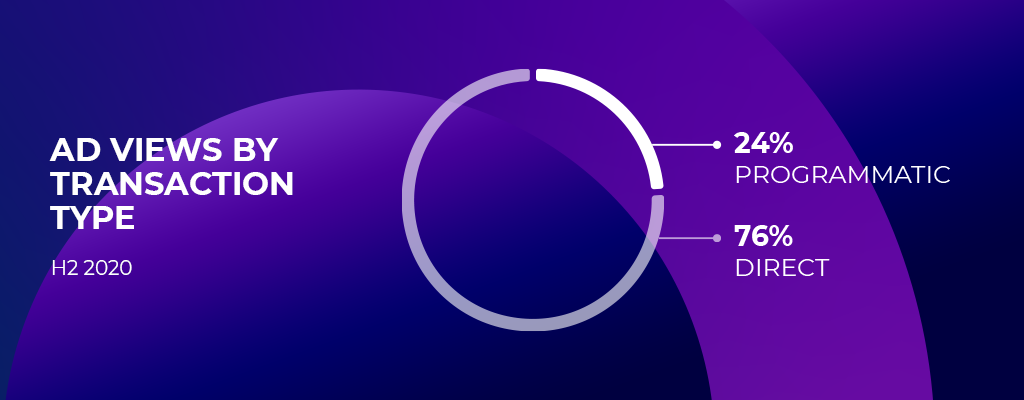
Originally developed for display advertising, in 2015 header bidding made the transition from to video. In 2017, AppNexus’s report, “Time to Press Play on Header Bidding for Video,” highlighted the potential revenue uplift associated with the tool. The next few years saw a flurry of programmatic solutions. Today, 24% of transactions are done programmatically, a number expected to grow even as premium publishers look to streamline their number of programmatic partners.
It is likely 2020 will prove to be an inflection point for digital video, and TV’s evolution. For more on this shift, and to access the timeline and H2 2020 data, download the U.S. H2 2020 Video Marketplace Report.